Code Snippets
GFS/GENS Visualizer
This work by Reto Stauffer and Felix S. Oesterle (2023) is licensed under the GNU General Public License v2. If you improve and/or extend the code it would be great to send me a message and the extensions such that I can include the changes in the original repository.
Repository available on bitbucket: https://bitbucket.org/retos/gensvis..
- Only tested with
python 2.7+, quite sure not yet fullypython 3ready.
A small script (not yet a proper python package!) for downloading current GFS and GENS (Global Forecast System, Global Forecast System Ensemble) weather forecasts. The GFS weather forecast model is maintained and run by the NOAA, the National Oceanographic and Atmospheric Agency of the United States. It is one of the most well known global weather forecast models – mainly because it is free :). The model runs four times a day and can be accessed live from around the world. The GFS is the deterministic “best guess” forecast, the GENS is an ensemble containing 21 different predictions to capture the uncertainty of the current weather forecast. I can’t and won’t to in detail here. For those not familiar with numerical weather forecast models: the output of such models are typically self describing gridded data sets (grib/HDF/NetCDF) and are quite huge. However, the NOAA also provides access to the data via a so called opendAP/DODS server which will be used by this small script. Some live examples can be found here: ertel2.uibk.ac.at - online weather platform of the Institute of Atmospheric and Cryospheric Sciences, University of Innsbruck. The link to the bitbucket repository can be found at the end of this page.
Features of the GENSvis Script
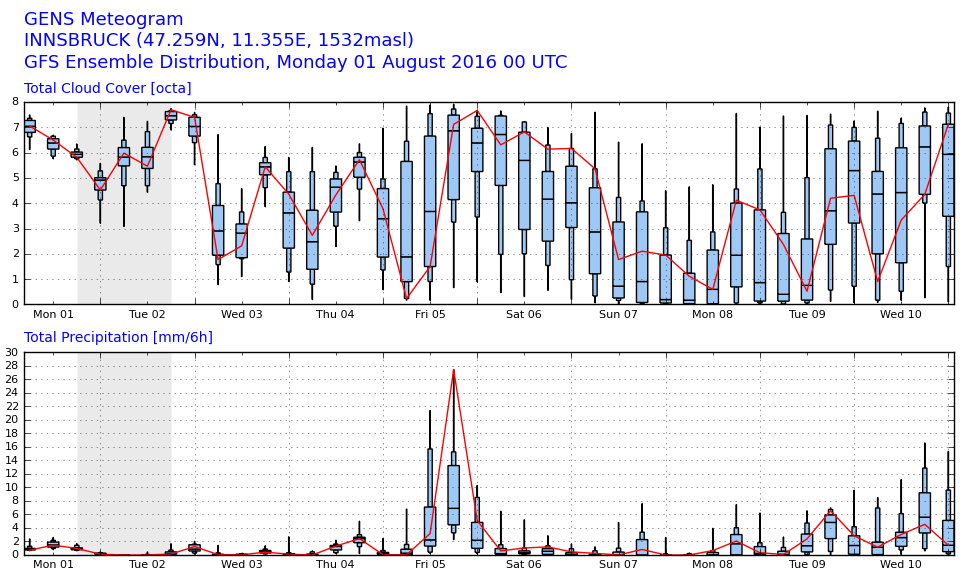
The original reason for this script was to create so called meteograms, meteorological diagrams showing the forecasts up to a few days for a set of forecast variables, like e.g., wind speed, temperature, cloud cover, or precipitation. Thanks to Felix Schüller who originally developed big parts of the visualization methods. The tool can also be used just to download and interpolate the data and save the raw forecast values into ASCII files – whatever the need will be.
Features of the tool:
- automatically downloads the latest available forecast for a set of user-defined cities or locations
- interpolating the data from the four nearest grid-points to the city (bi-linear interpolation)
- save and/or draw the data. Two types of visualizations can be choosen
- handling deterministic GFS forecasts and/or ensemble forecasts using the GENS forecasts
- forecast time horizon and variables can be defined by the user
- only downloading the necessary subset as specified by the user: no need to download huge data sets
- parallel download
The tool is written in python2 and requires a set of modules. Namely:
- python numpy, and scipy
- Pydap (openDAP access)
- matplotlib (for the graphical output)
Install software (Linux; example for Ubuntu)
Note: There is/was an issue with the Pydap 3.2.2 package version
(error invalid start byte, see github issue).
This issue has been fixed but currently requires manual installation of the
latest Pydap` package version from
github.com/pydap.
Small installation script using virtual environment:
## Using local virtual environment
## to install the required packages.
## Please note: tested for python 2.7+, quite sure
## the code is not fully ready for python 3.+!
virtualenv --no-site-packages venv
source venv/bin/activate && pip install matplotlib pydap requests scipy

## There is an issue with current stable pydap package!
## Install it from git directly which solves the problem
## (issue reading the first byte of the file).
## Download Pydap from git and install into virtualenv.
wget https://github.com/pydap/pydap/archive/master.zip -O pydap.zip && \
    pip install pydap.zip && rm pydap.zip

## Clone code from git repository
git clone git@bitbucket.org:retos/gensvis.git && cd gensvis

## Copy config files.
## Please check out the config file content to see
## all available options.
cp GFS_config.conf.template  GFS_config.conf
cp GENS_config.conf.template GENS_config.conf

## Create output directory to store the images.
mkdir images

## Starting the scripts to visualize the metgrams.
## Please be sure that the virtualenv is active
## if you are using python virtualenv!
## Either by:
## * source ../venv/bin/active
## Or directly call the venv binary:
## * ../venv/bin/python GFSvis.py
## * ../venv/bin/python GENSvis.py
python GFSvis.py  # GFS deterministic
python GENSvis.py # GFS ensemble (GENS)
The Config Files
Station Definition
By default, the script will visualize station Innsbruck, Austria.
However, you can of course visualize other locations as well.
This can be cone by changing the GFS_config.conf and GENS_config.conf
files or by using the input argument -s/--statlit directly.
.conffiles: Thestatlistdirandstatlistoptions define the location of the default station list file. If input argument-s/--statlistis not set this file will be read. The station list file is a simplecsvfile containing name and location of the stations which have to be visualized.-s/--statlistoption: you can also trigger the scripts using a different station list from the console viapython GFSvis.py -s MYSTATLIST.csv. This allows to run several different station lists by script.
Please note: if you are visualizing several locations far apart from each other it makes sense to create several station list files grouping stations close to each other. The script spans a rectangular grid over all requested sites and downloads the gridded data set covered by the extent of this rectangular sub-area. In the worst case you are downloading a global grid to plot meteograms for two sites. In this case better set up two station lists, one for each station, as only two times four grid points would have to be downloaded this way.
Other Settings
The config files allow for more than just changing the station list.
Please have a look at the comments in the .config template files
to see what’s possible. To keep it short, this includes:
- Disable/enable raw data output (
datadir). - Controlling download (
parallel,caching). - Change output image size, location, style (
[image]). - Add/remove parameters to be plotted (
parameter,[parameter ...]).